Finance Dashboard
/
Digital design
User Experience (UX) Design
The dashboard was inspired by the need to turn raw financial data into clear insights, empowering users to understand their growth and predict what’s next.
No items found.
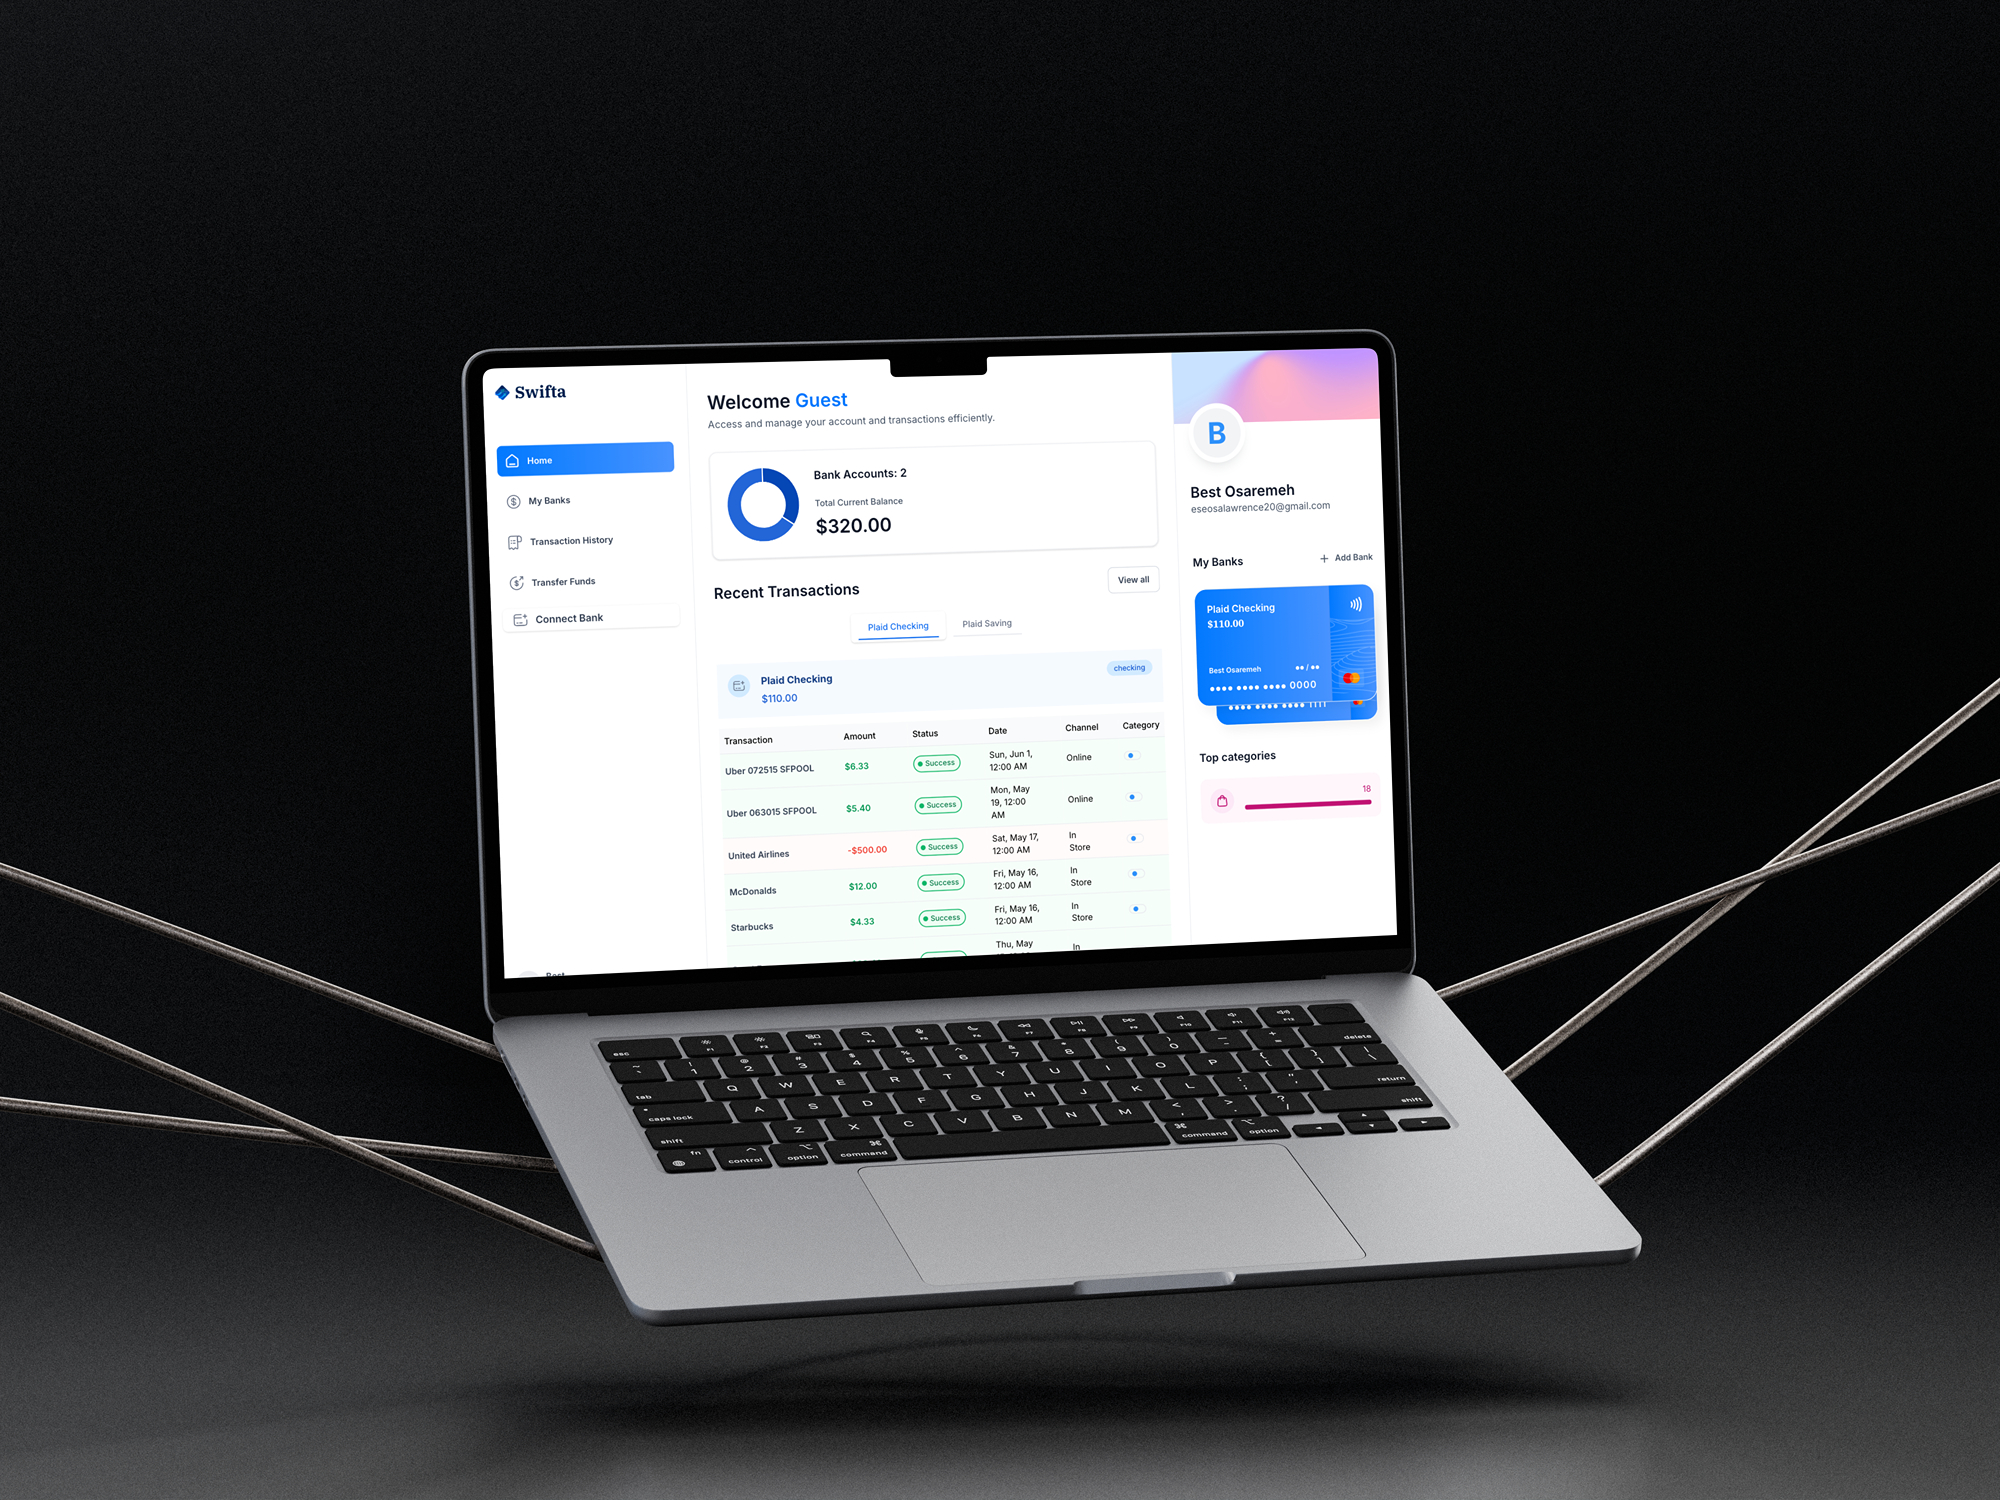
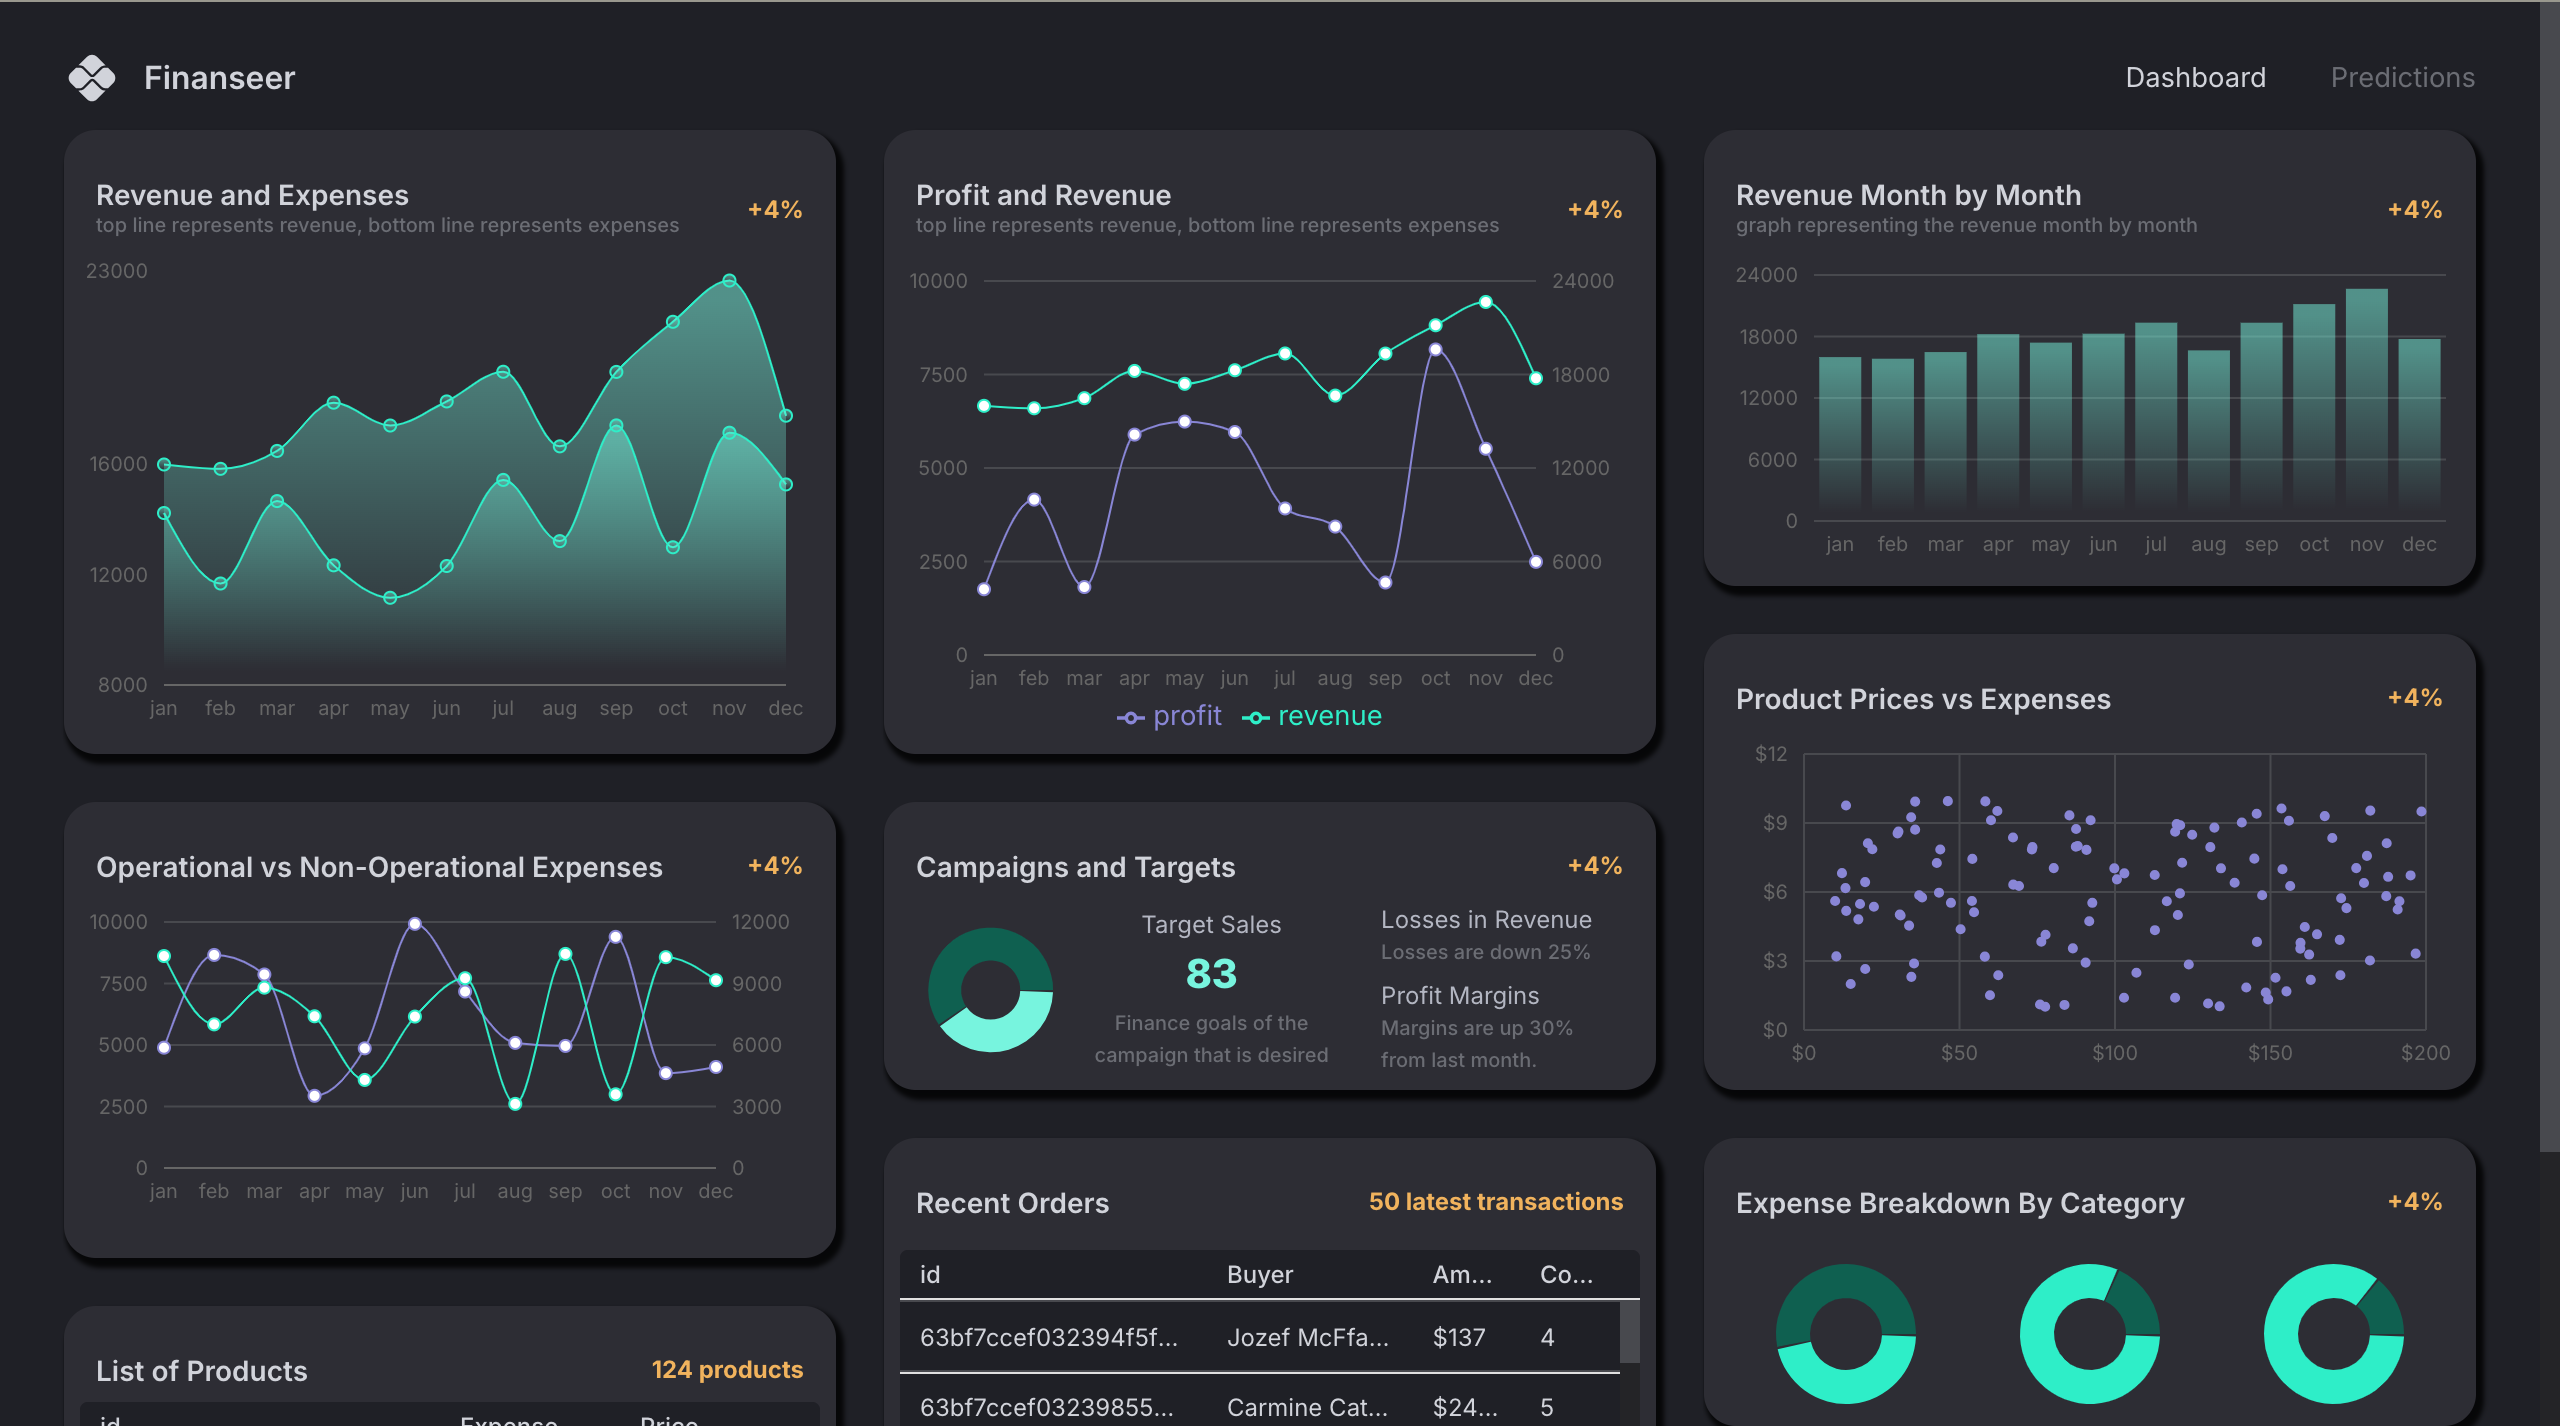
This Finance Dashboard was built to strip away the fluff and deliver exactly what users need: a real-time view of revenue and profit, displayed through clean and responsive visualizations. Using Recharts, users can filter and interact with data to track how their business is actually performing, not just how it performed.
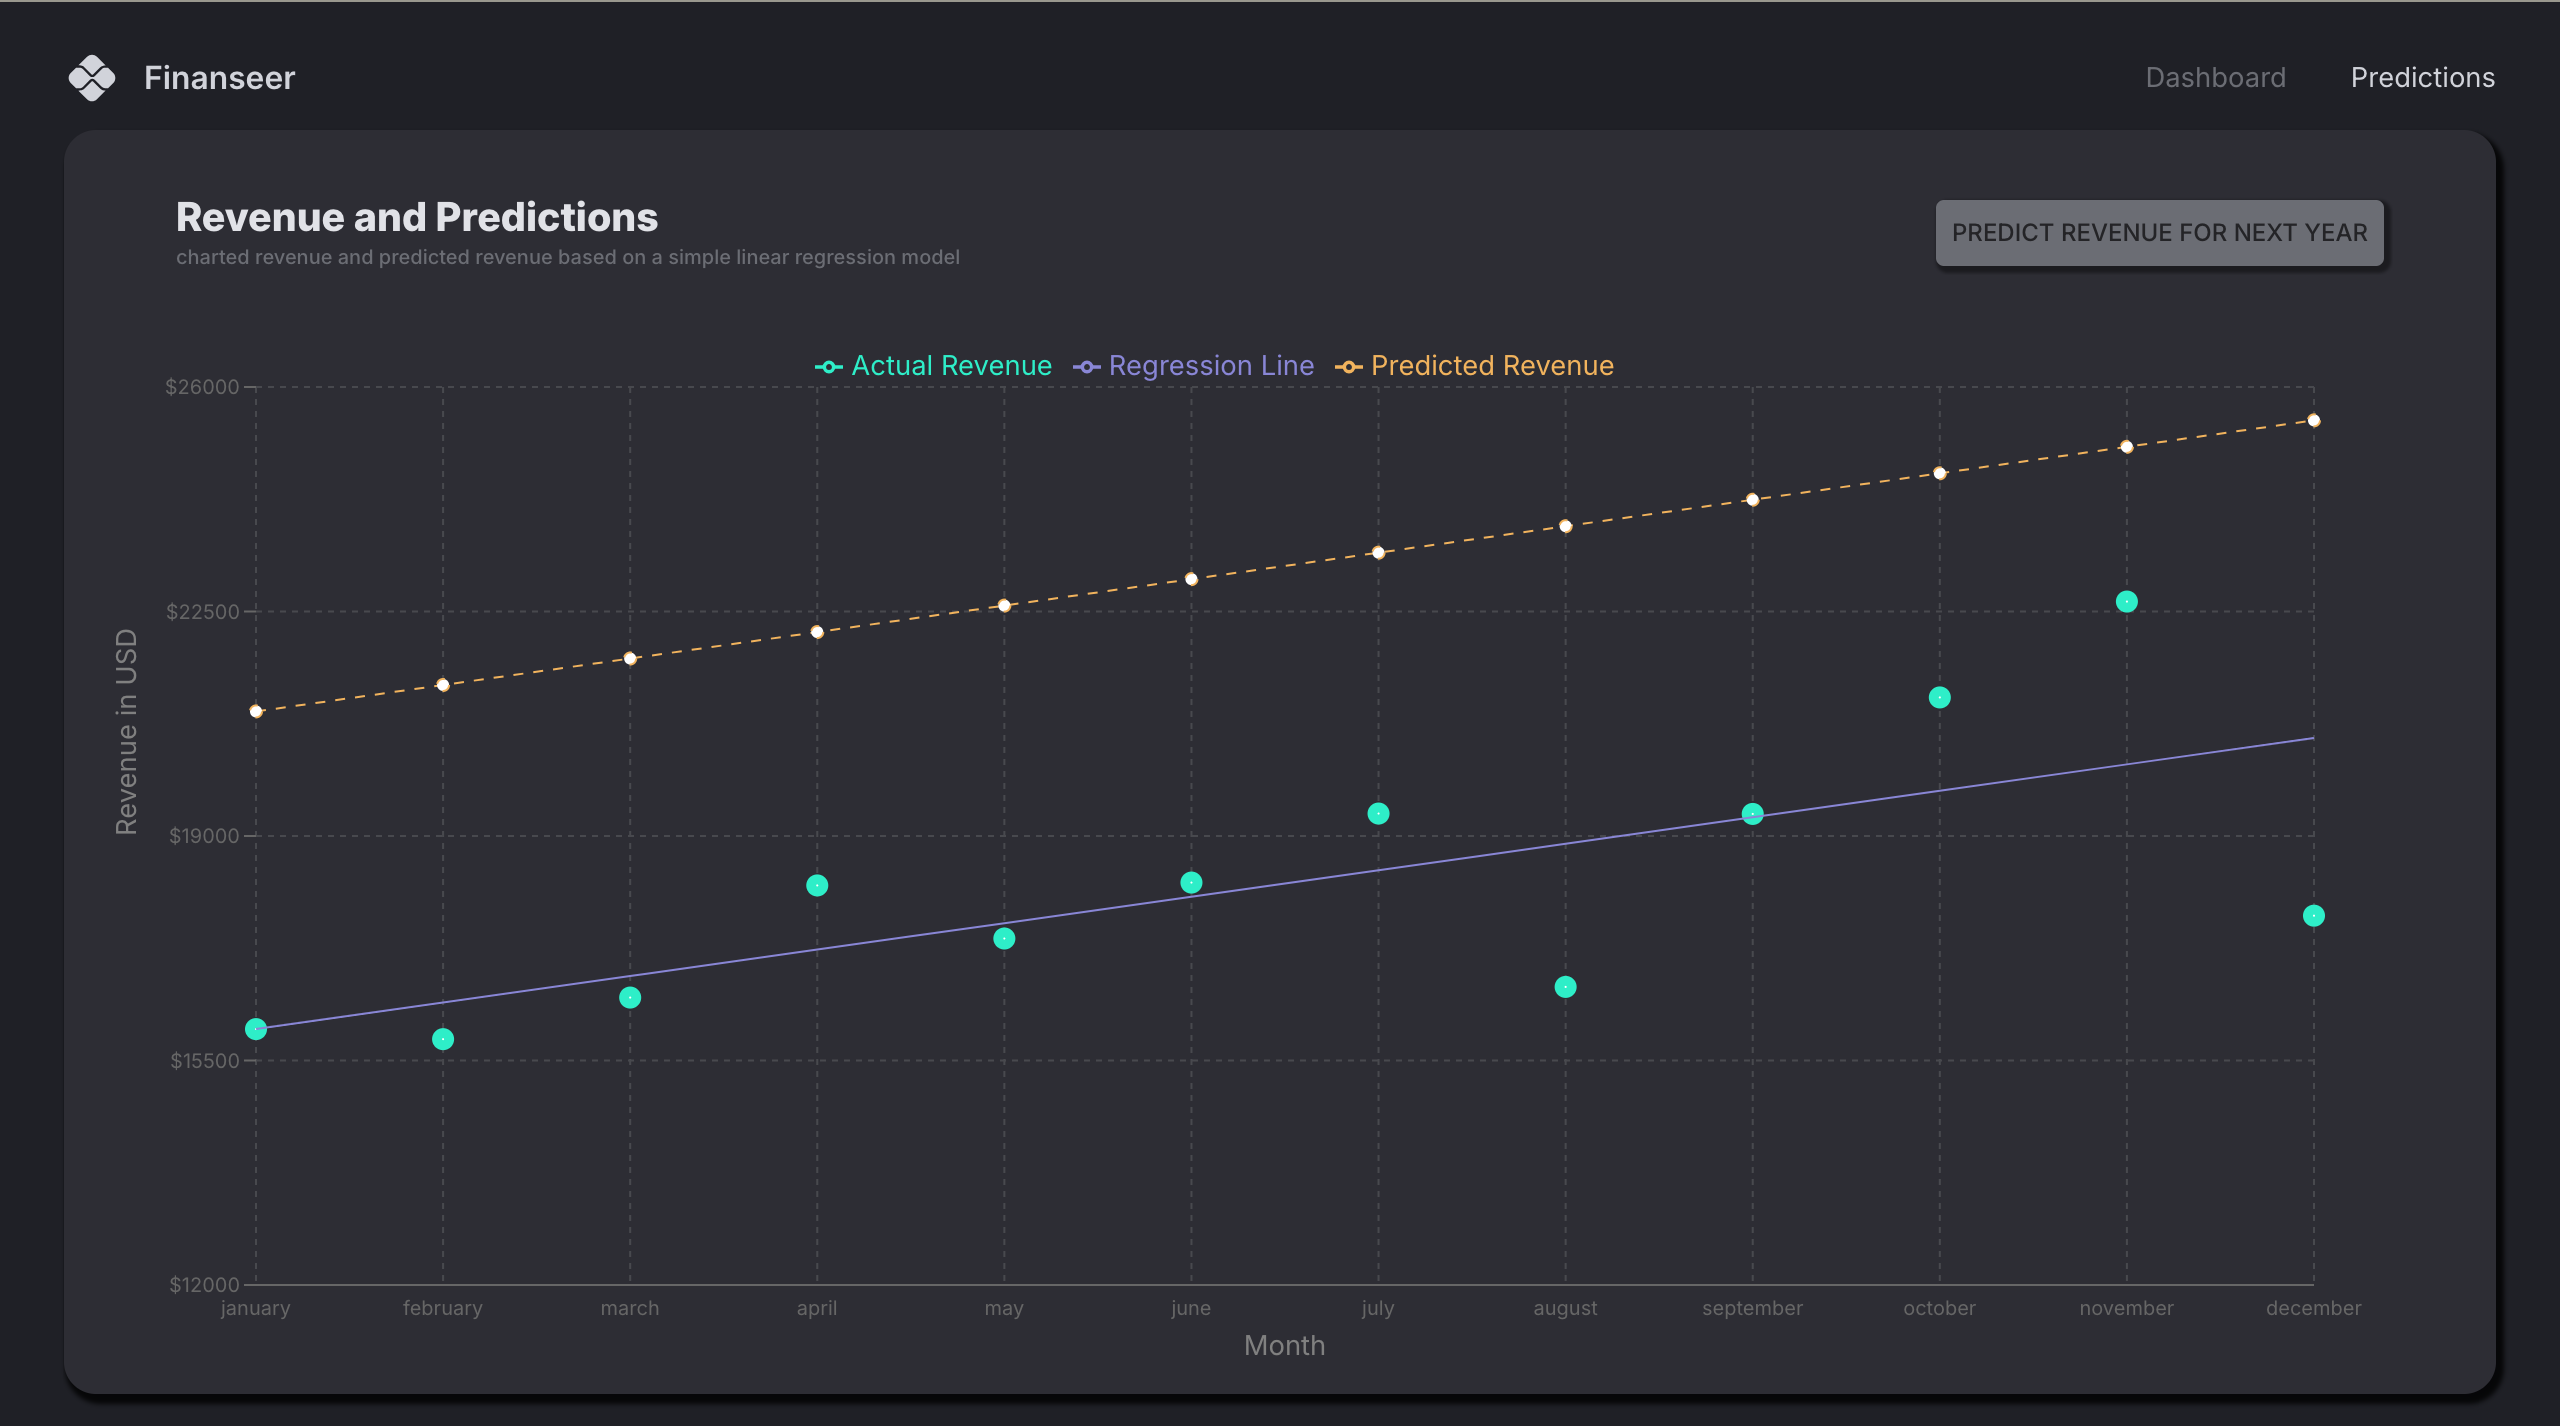
On the backend, MongoDB and Express handle secure, efficient data flow, while React and Material UI bring structure and clarity to the frontend UI. But the real differentiator is the built-in machine learning model that runs historical revenue through a basic prediction algorithm, outputting a realistic forecast of where the business might be financially a year from now.